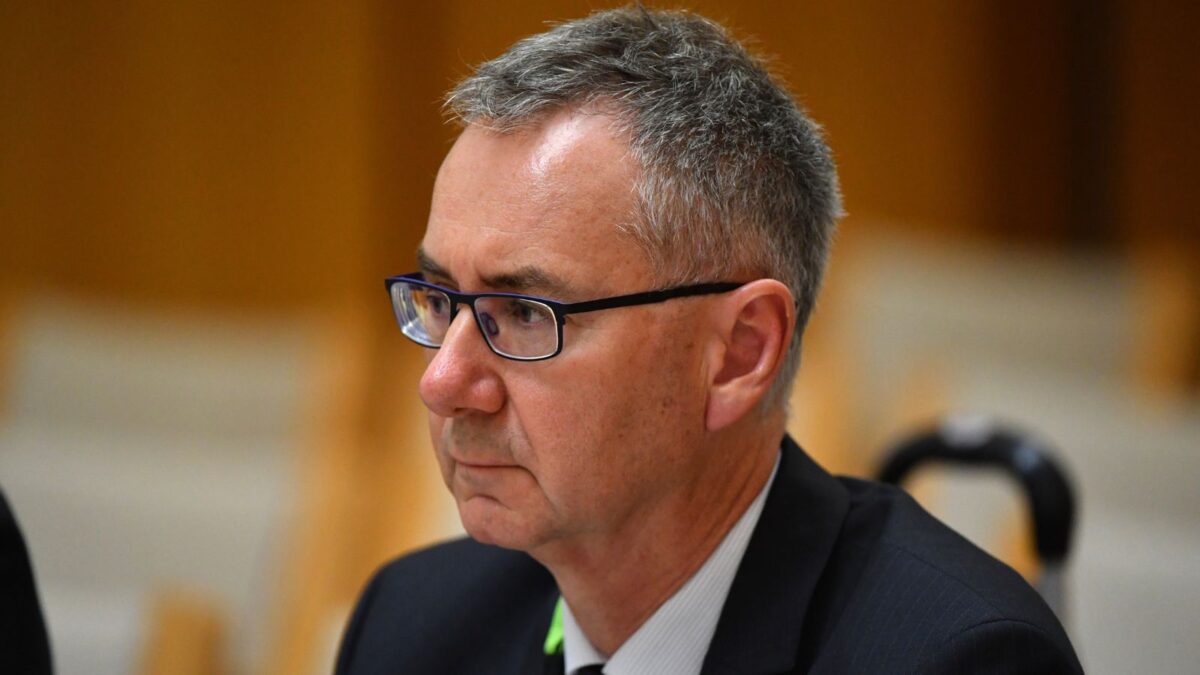
Few would disagree that a strong regulator is required for a strong superannuation system. But APRA’s myopic focus on cost to members means its $70,000 Christmas party is unlikely to help its reputation.
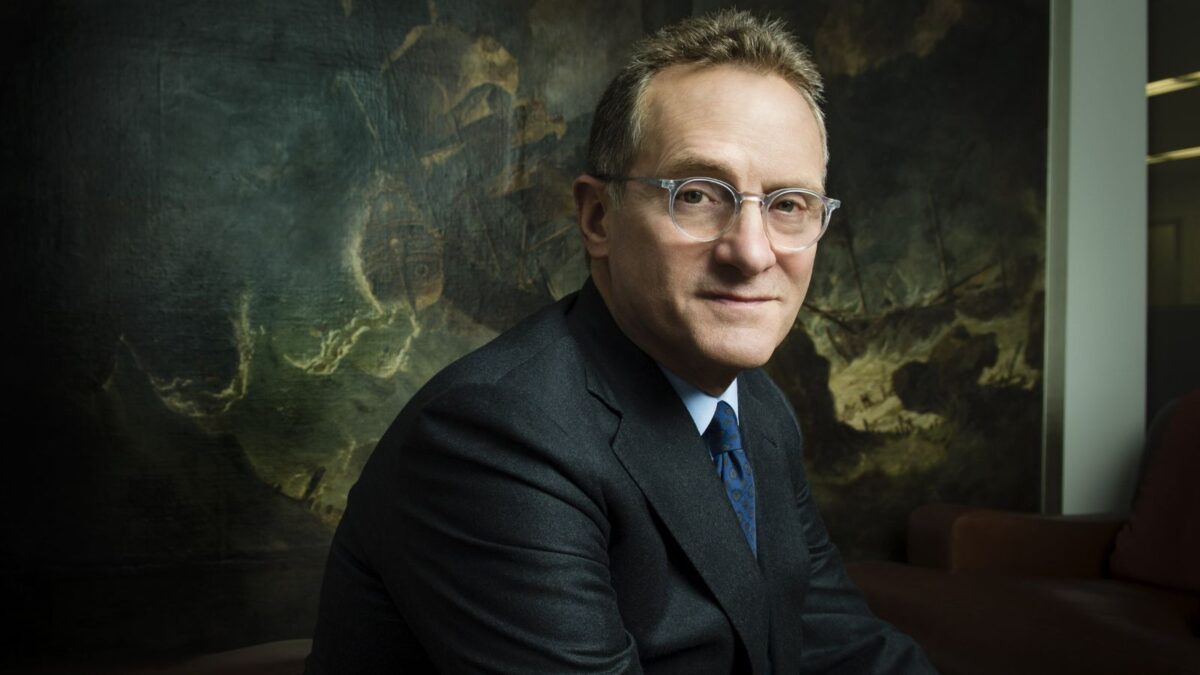
Good investing requires real sacrifices, according to Oaktree’s Howard Marks, but you can’t expect to be compensated just for making them.
How the world’s biggest funds coped in 2020
Most of the world’s largest institutional investors – 438 sovereign wealth and public pension funds – had a tough time last year. They had to cope with government capital drawdowns alongside market volatility and other problems due to the pandemic.
According to the annual report of Global SWF, a private organisation that researches the space, capital calls were made on 26 funds, totalling $US162 billion (A$208 billion).
However, given that, in total, the funds hold an average of nearly three-quarters of their investments in liquid securities, they continued their asset growth trajectory, ending 2020 with an estimated US$27.5 trillion. Sovereign wealth funds (SWFs) assets increased from US$8.7 trillion to US$9.1 trillion, while public pension funds (PPFs) grew from US$17.9 trillion to US$18.4 trillion.
The liquid investments were helped by strong rebound performances, after March, by both equity and bond markets. The S&P 1200 global equities index was up 13.1 per cent for the year and the S&P 500 bond index up 10.2 per cent. According to the IMF, the world’s GDP slumped 4.4 per cent.
The researchers remain critical of the investment performance of the big state-owned investment funds (SOIs) and the report says that returns shown by the top 100 need to improve. PPFs had their worst return since 2008, eking out a gain of just 0.3 per cent (last year 11.7 per cent), while SWFs, whose returns tend to be more volatile than that for PPFs, earned minus 2.2 per cent (last year a positive 18.3 per cent), which was their worst performance since 2018. SWFs suffered a minus 21.6 per cent total return in 2008, compared with minus 12.6 per cent for PPFs.
The report highlights the performance of a number of funds for either good or poor returns, noting that they had a range of reporting dates, from March through to June, September and December (not included), so short-term comparisons are not possible.
Nevertheless, of the June 30-balancing funds, the report described NZ Super and the Future Fund as “standouts”. On a five-year accumulated returns basis, NZ Super was number one with 9.5 per cent and the Future Fund number two with 8.0 per cent (all figures are calculated in $US).
Global SWF has a broader definition of SWFs than the IMF does and also includes some funds, such as Australia’s industry funds and state-government-owned fund managers, in its PPFs category that make up the SOI universe.
The report says: “One thing the industry needs to improve is returns. Global SWF has undertaken a comprehensive analysis of the industry’s profitability, based on the asset allocation and benchmarks of the Top 100 SOIs.
“The results are illuminating and troubling. SWFs have returned, on average, 5.0 per cent per annum in the past 12 years. This compares with 4.8 per cent scored on average by their benchmarks and suggests a SWF industry alpha of 0.2 per cent. Similarly, PPFs have returned on average 5.6 per cent versus a reference of 4.6 per cent, giving a PPF industry alpha of 1.0 per cent.”
The researchers note that both different reporting dates and very different mission statements, leading to different asset allocations, especially among the various types of SWFs, make comparisons difficult. Nevertheless, they note some trends and the best performers among the top 10 in each SWF and PPF groupings. They are, in order of performance on a cumulative basis for the six years to 2020:
SWFs: NZ Super (9.5 per cent), Future Fund (8.0 per cent), China’s CIC (6.8 per cent), Alaska PFC (6.2 per cent), Korea’s KIC (5.5 per cent), Singapore’s Temasek (5.3 per cent), Norway’s NBIM (5.2 per cent), Hong Kong’s HKMA (3.1 per cent), Singapore’s GIC (2.3 per cent) and UAE’s ADIA (minus 3.5 per cent).
PPFs: Canada’s CPP (9.4 per cent), Canada’s CDPQ (8.1 per cent), AustralianSuper and Canada’s OTPP (both 7.9 per cent), Canada’s PSP (7.2 per cent), the US CalSTRS (6.5 per cent), The Netherlands’ APS (6.4 per cent), the US CalPERS (5.6 per cent), Korea’s NPS (5.3 per cent), and the world’s biggest pension fund, the Japanese GPIF with U$1.6 trillion in assets (2.7 per cent).
Australian funds in the top 100, by assets, are: Future Fund (number 28 with US$150 billion); AustralianSuper (31st with US$125 billion); and, government-owned managers QIC (36th, US$93 billion) and, VFMC (53rd, US$41 billion). NZ Super is ranked 61st with US$31 billion.
It is unclear why Australian Super, which announced last month that it had passed the A$200 billion mark, is included in the PPFs and not a number of other large industry funds. The smallest PPF in the top 100 is listed as Canada’s OP Trust, at 74th with US$17 billion.
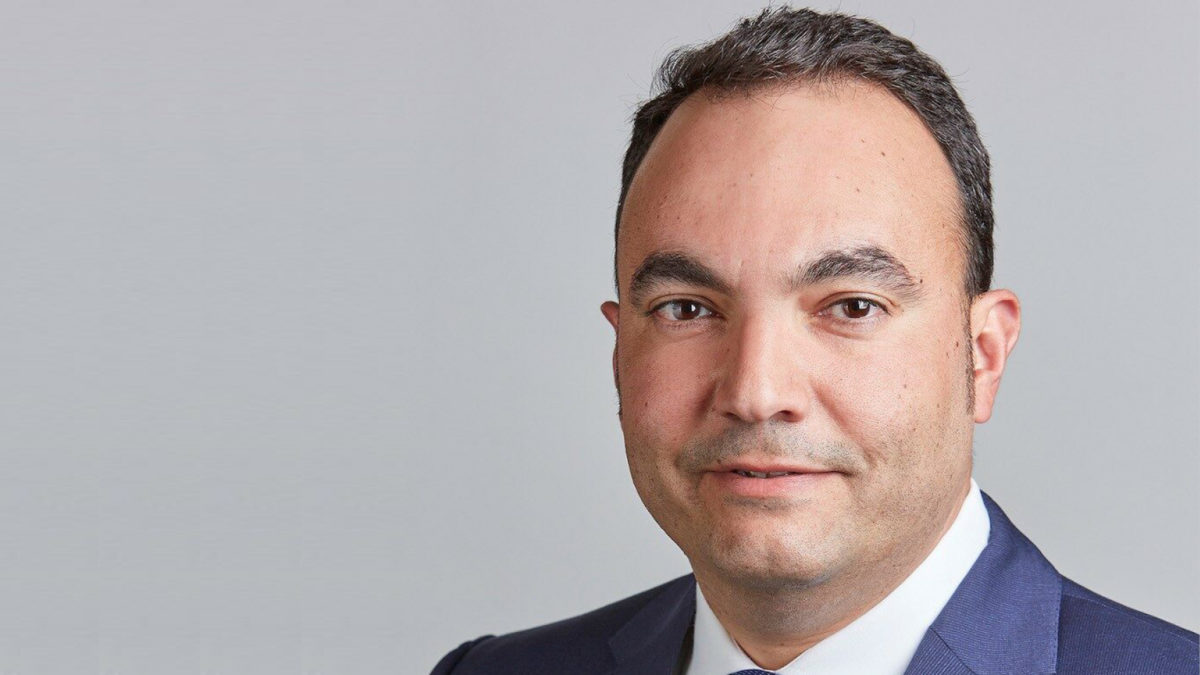
Global SWF, founded in 2018 by Diego Lopez, has three lines of business: consulting services, mainly for governments; fund raising for managers targeting SOIs on a third-party marketing basis; and data services. Prior to starting Global SWF, Lopez spent five years at PwC building the firm’s footprint among SWFs and other SOIs.