Equity trading drag another burden for funds
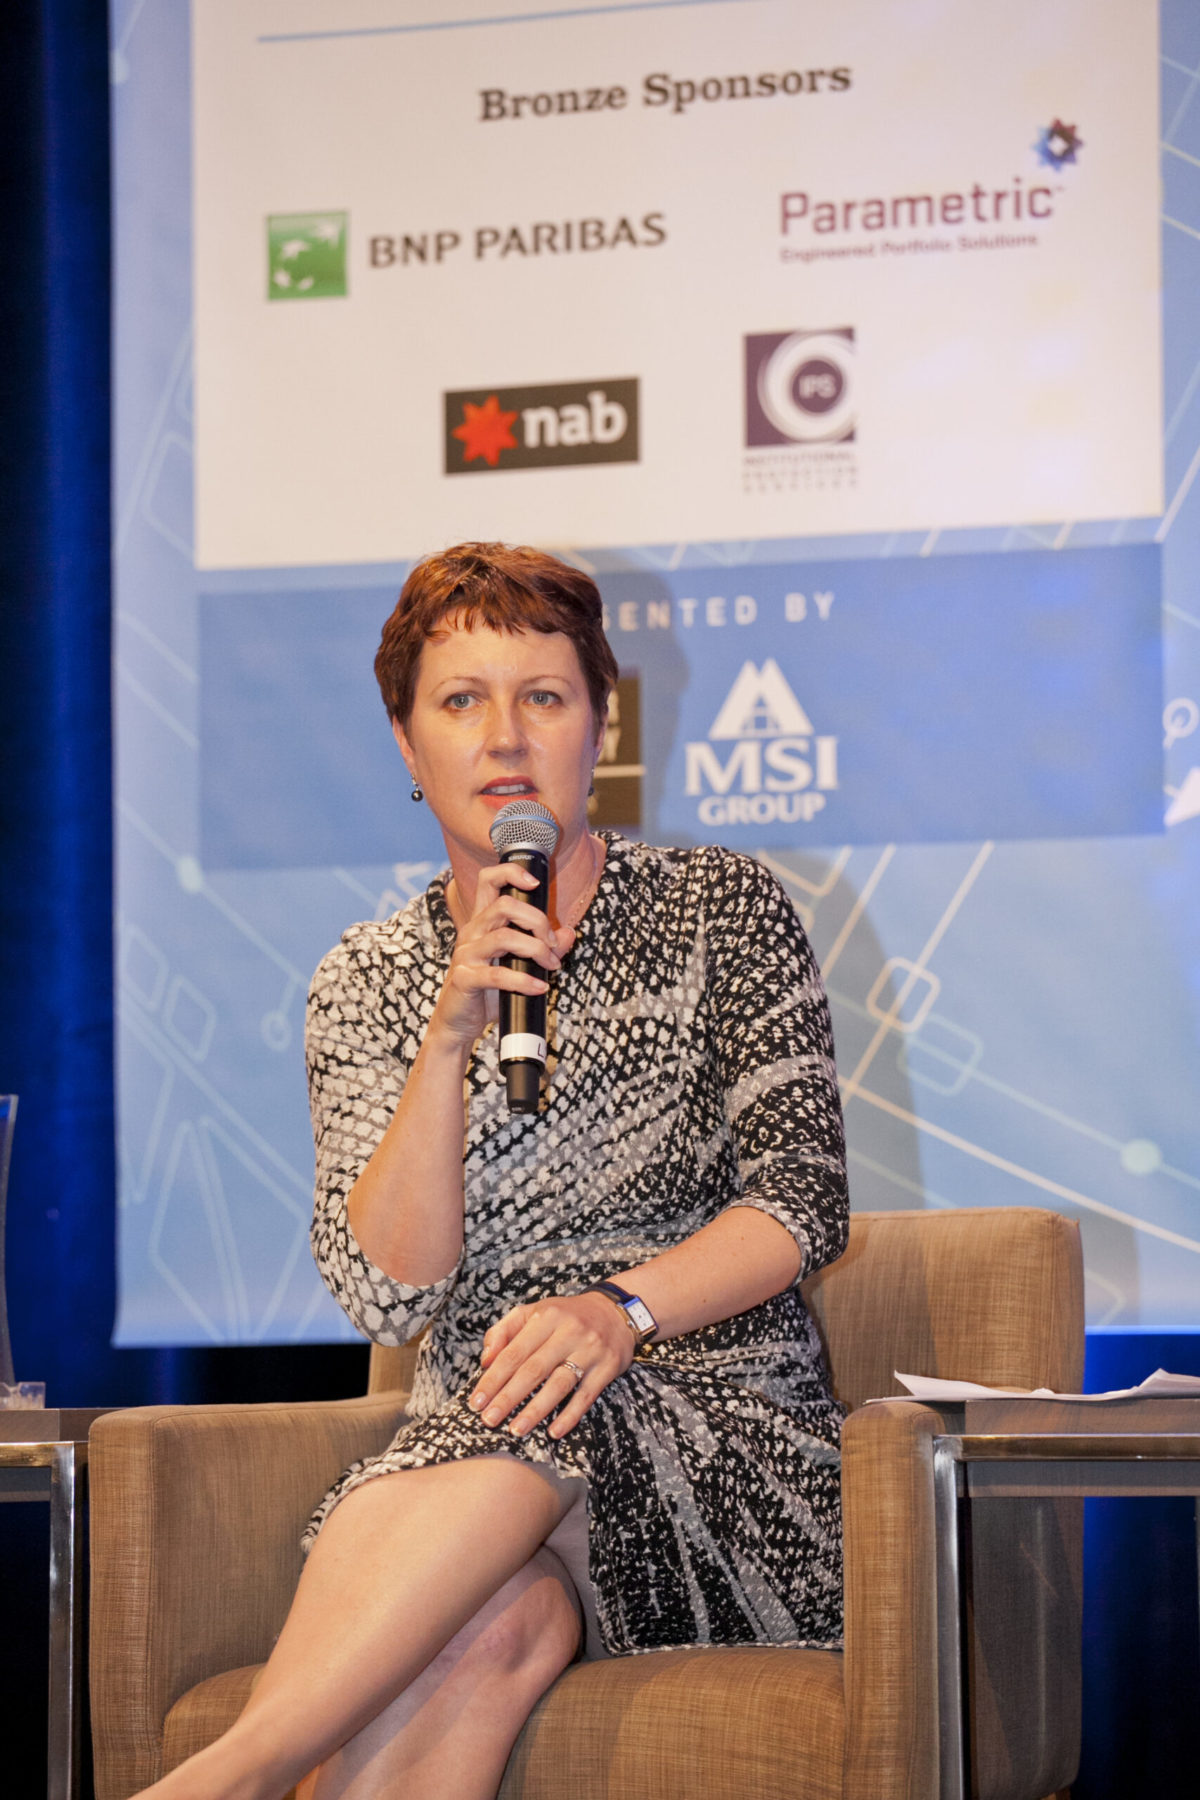
(pictured: Raewyn Williams)
New research by Parametric Australia has quantified real and potential drag on the performance of big super funds through the Australian and international equity trading activities of their managers. Costs can blow out to as much as 119bps for an Aussie equities portfolio.
According to Raewyn Williams, head of research of the Australian arm of the Seattle-based fund manager, there are significant savings available based on how a portfolio is traded, but most funds have very little information about how much equity trading costs, and how efficiently they make their trades.
Williams said: “Trading Australian and international equities, which, on average, comprise 44 per cent of their total funds invested, is the funds’ bread-and-butter investment activity, and it’s imperative they give the issue more attention. This is another area of implementation efficiency where there could be considerable savings to be made.”
Williams and fellow researcher Mahesh Pritamani published the research paper, “Under the Spotlight: How Much Does it Cost to Trade Equities”, last week after it was previewed at last month’s My Platform Rules conference, as previously reported.
Williams says the trading costs measured should include both explicit and implicit trading costs – the latter, including spreads and price impacts, is highly variable and skill-dependent.
She says: “What our research shows is that a great deal of skill is required to trade well and a great range of outcomes are possible,” she said. “To trade a passive Australian equity portfolio patiently, full costs begin at 21bps per $1 traded and can rise to as much as 66bps per $1 traded. To trade a passive international equity portfolio patiently, costs begin at 11bps per $1 traded and can rise to 26bps per $1 traded. This is the most conservative scenario.
“Other scenarios can see trading costs rise as high as 119 bps per $1 traded for an Australian equity portfolio and 32 bps per $1 traded for an international equity portfolio. Quite clearly the cost of trading equities can be a material drag on performance.”
The main driver of explicit trading costs is whether research is included in the service, or if it is execution only and the amount of ‘order flow’ directed to the broker.
The main drivers of implicit trading costs are the asset class traded (e.g. Australian equities cost more than international equities), the size of the trades, how ‘active’ the portfolio is (relative to index weighted investments) and how aggressive the trading style is.
“The need to confirm that trading is done efficiently, therefore, is greater the larger the fund is, the more the fund allocates to Australian equities instead of international equities and/or the more urgent or aggressive the fund’s or managers’ trading styles are,” Williams says.
“Funds should demand transparency from their managers and/or internal teams so they can measure trading costs and assess the efficiency of their underlying trades.
“Trading should not be a ‘black box’ and the ability to scrutinise all aspects of a fund’s investment portfolio is a valuable element of good fiduciary practice.”


